Subsurface Explorer
A unified subsurface data platform for the UK Continental Shelf — turning fragmented NSTA open data into interpreted, analytics-ready 3D intelligence.
Overview
Much of the public offshore exploration and development data for the UK Continental Shelf held by the North Sea Transition Authority is provided via geospatial feature services, allowing geographic features to be consumed directly by compatible geographic information systems. However, there is a significant proportion of NSTA open data provided in file format, with the feature services acting as a spatial catalogue pointing to these files. Most of the data stored in the file formats is inherently spatial but is often fragmented and distributed across legacy interchange formats — multiple shapefiles, LAS well logs, spreadsheets and separate databases.
Subsurface Explorer resolves this fragmentation through a set of purpose-built ingest wizards and pipeline scripts that turn scattered file deliverables into a single, coherent geospatial database. Shapefiles, GeoPackages and LAS well logs are scanned, validated and matched against reference wells and stratigraphic vocabularies (BGS Lexicon, ICS Chronostratigraphic Chart) before being ingested. Deviation surveys are transformed through minimum-curvature calculations to position every log, core sample and horizon pick in true 3D space, and voxel-building scripts fuse gridded surfaces and lithology into browsable geological volumes. The result is a versioned, self-consistent analytics-ready geodatabase ready to be filtered and visualised as one coherent 3D picture of the subsurface.
From regional overview to well-level detail
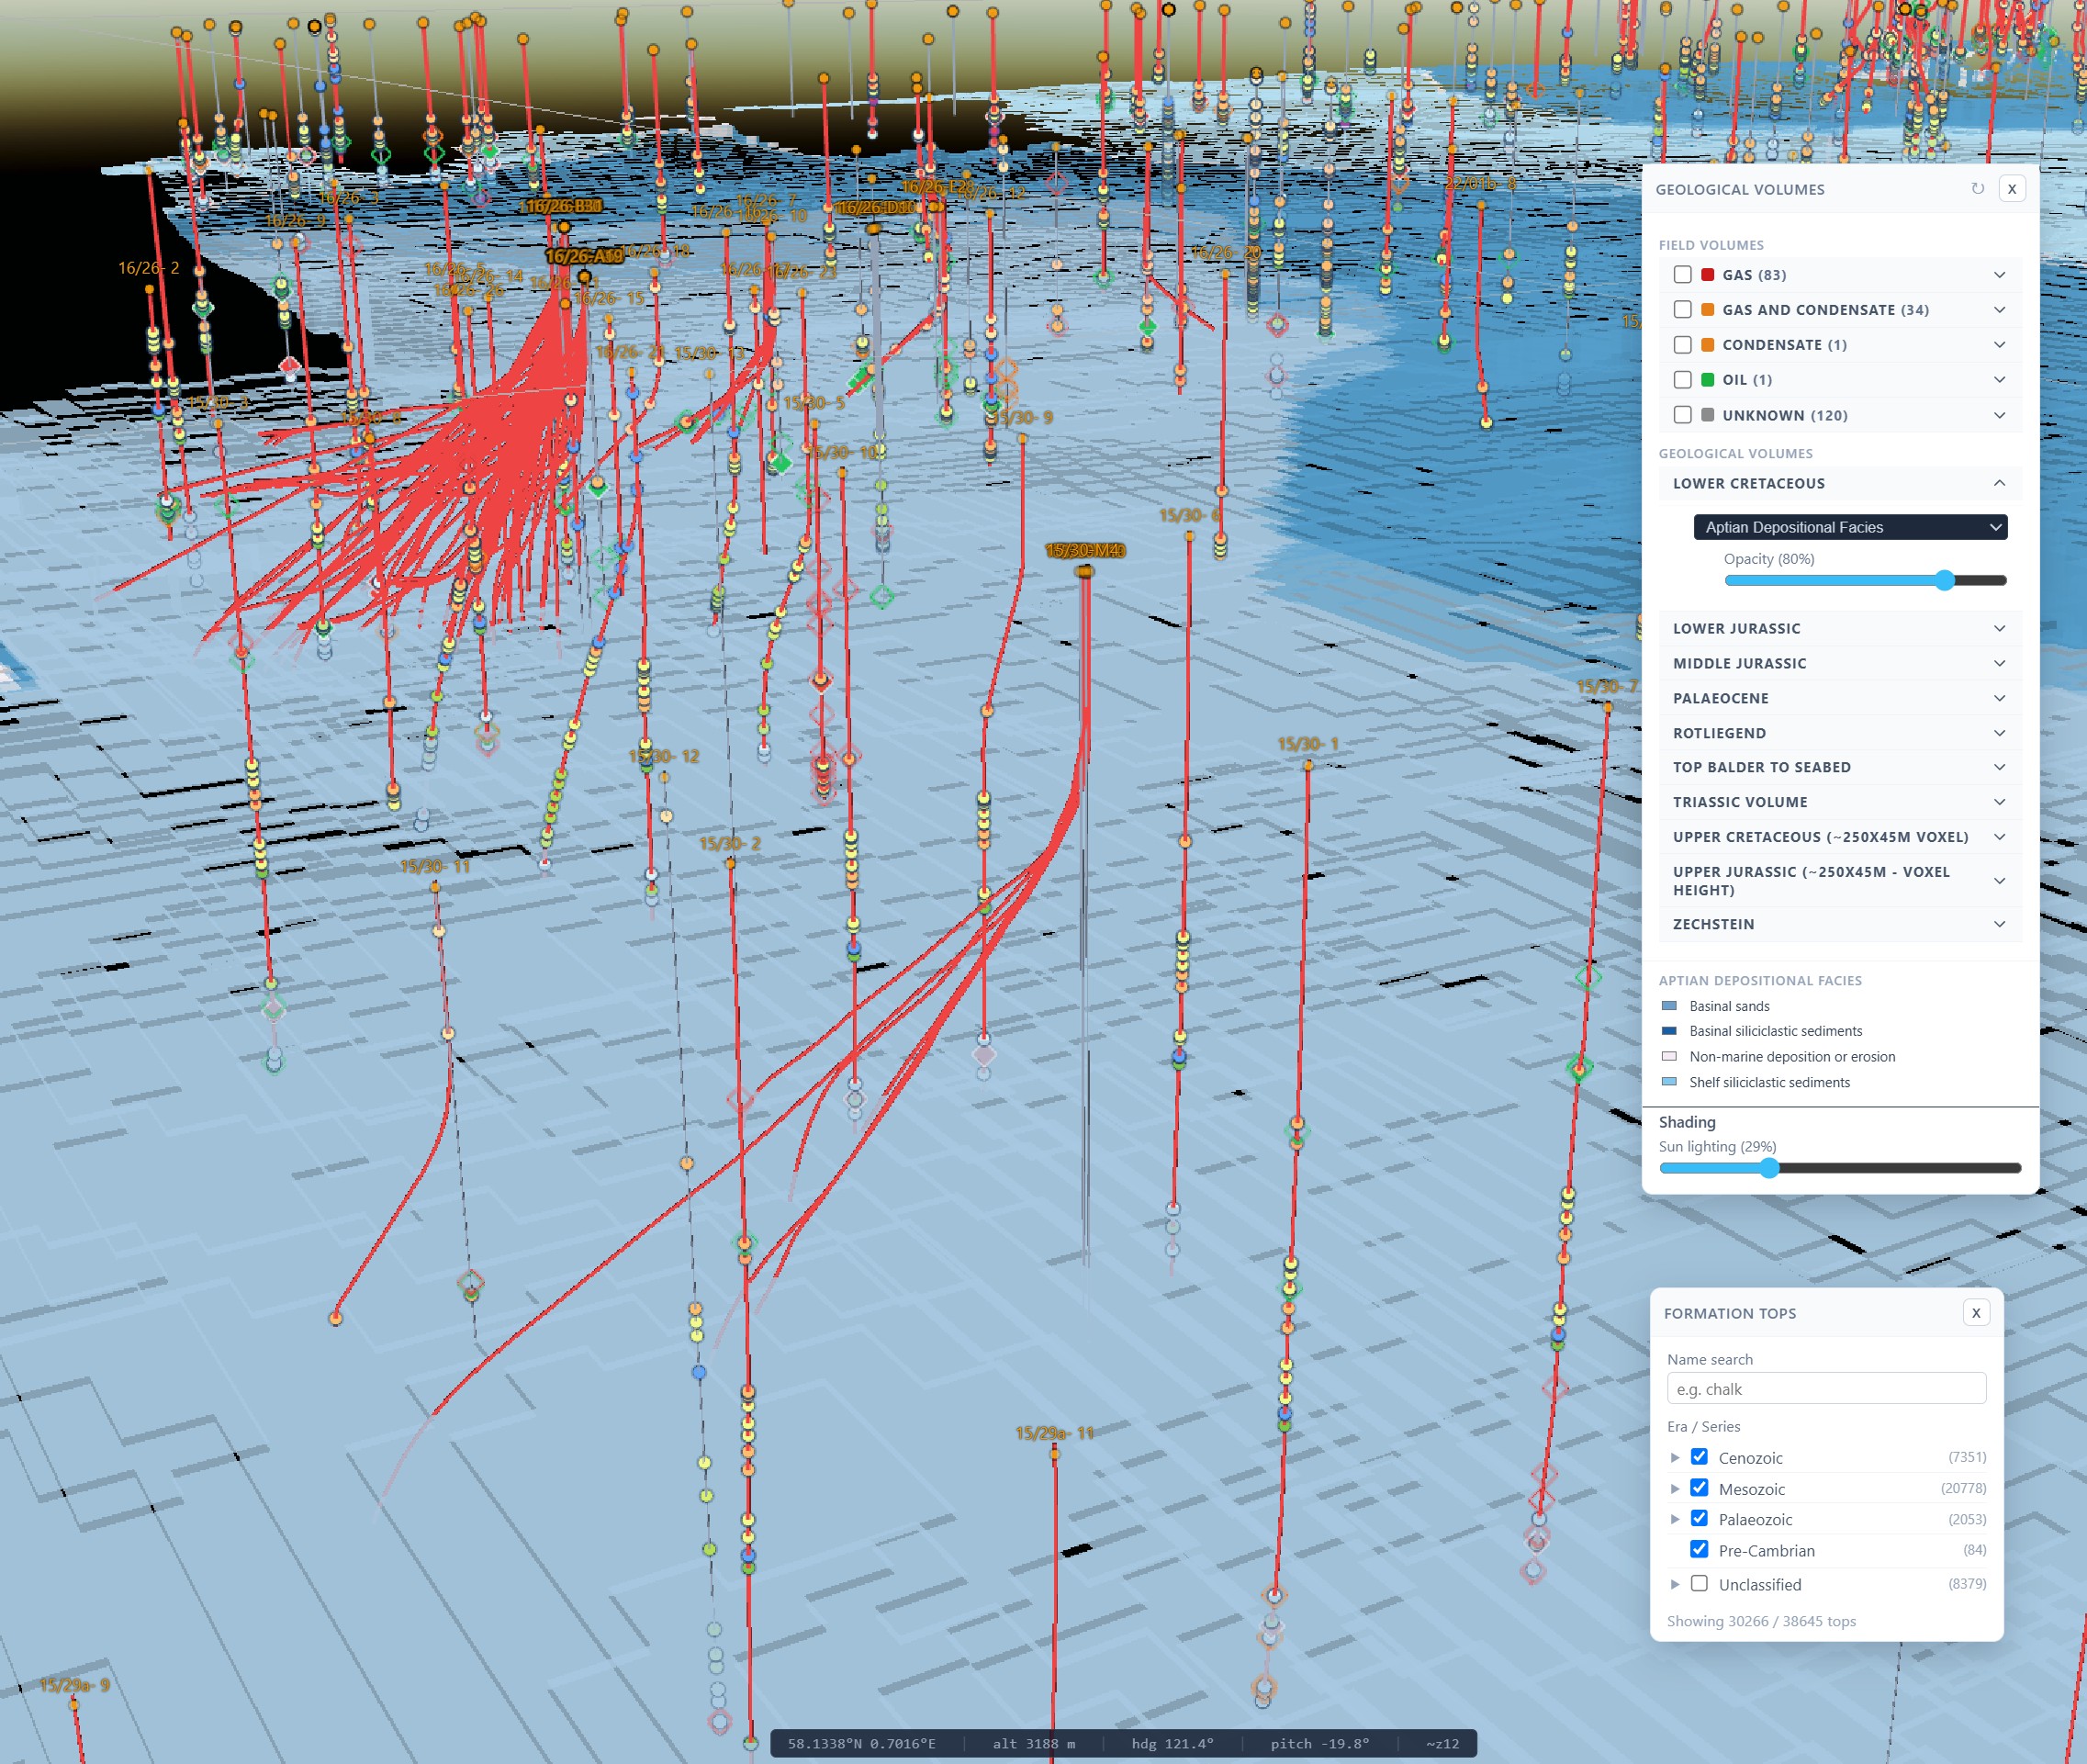
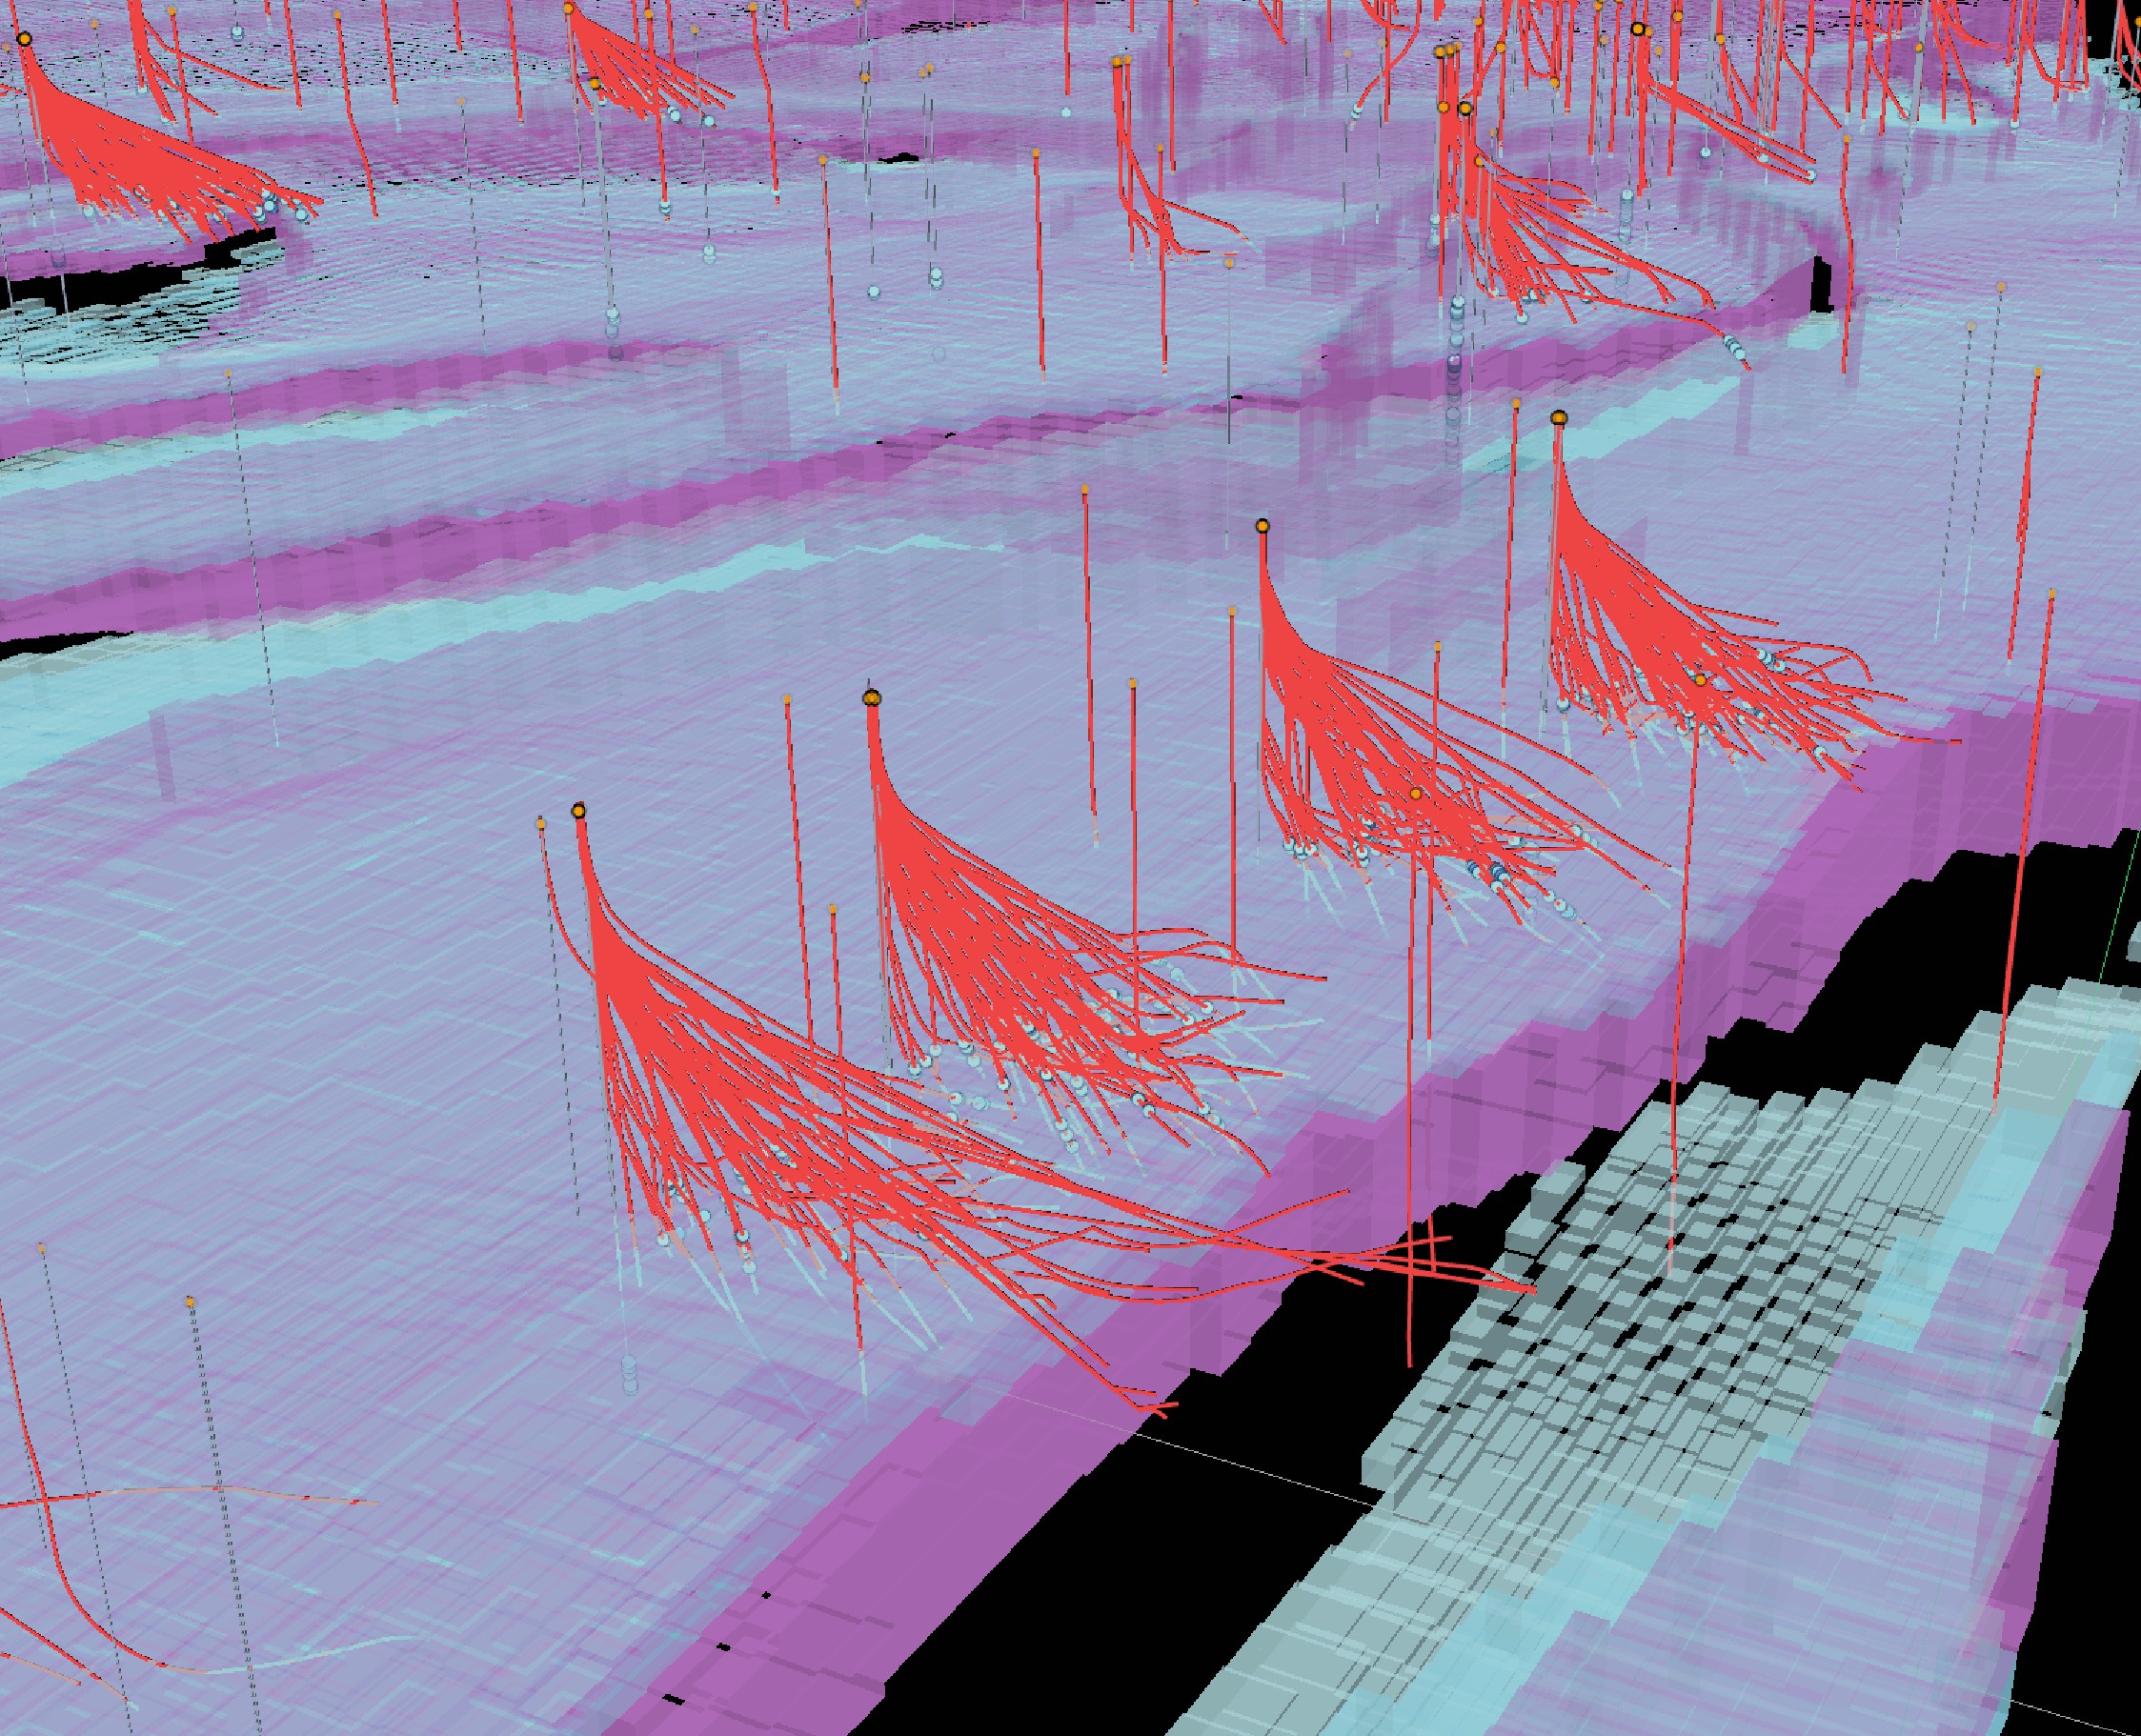
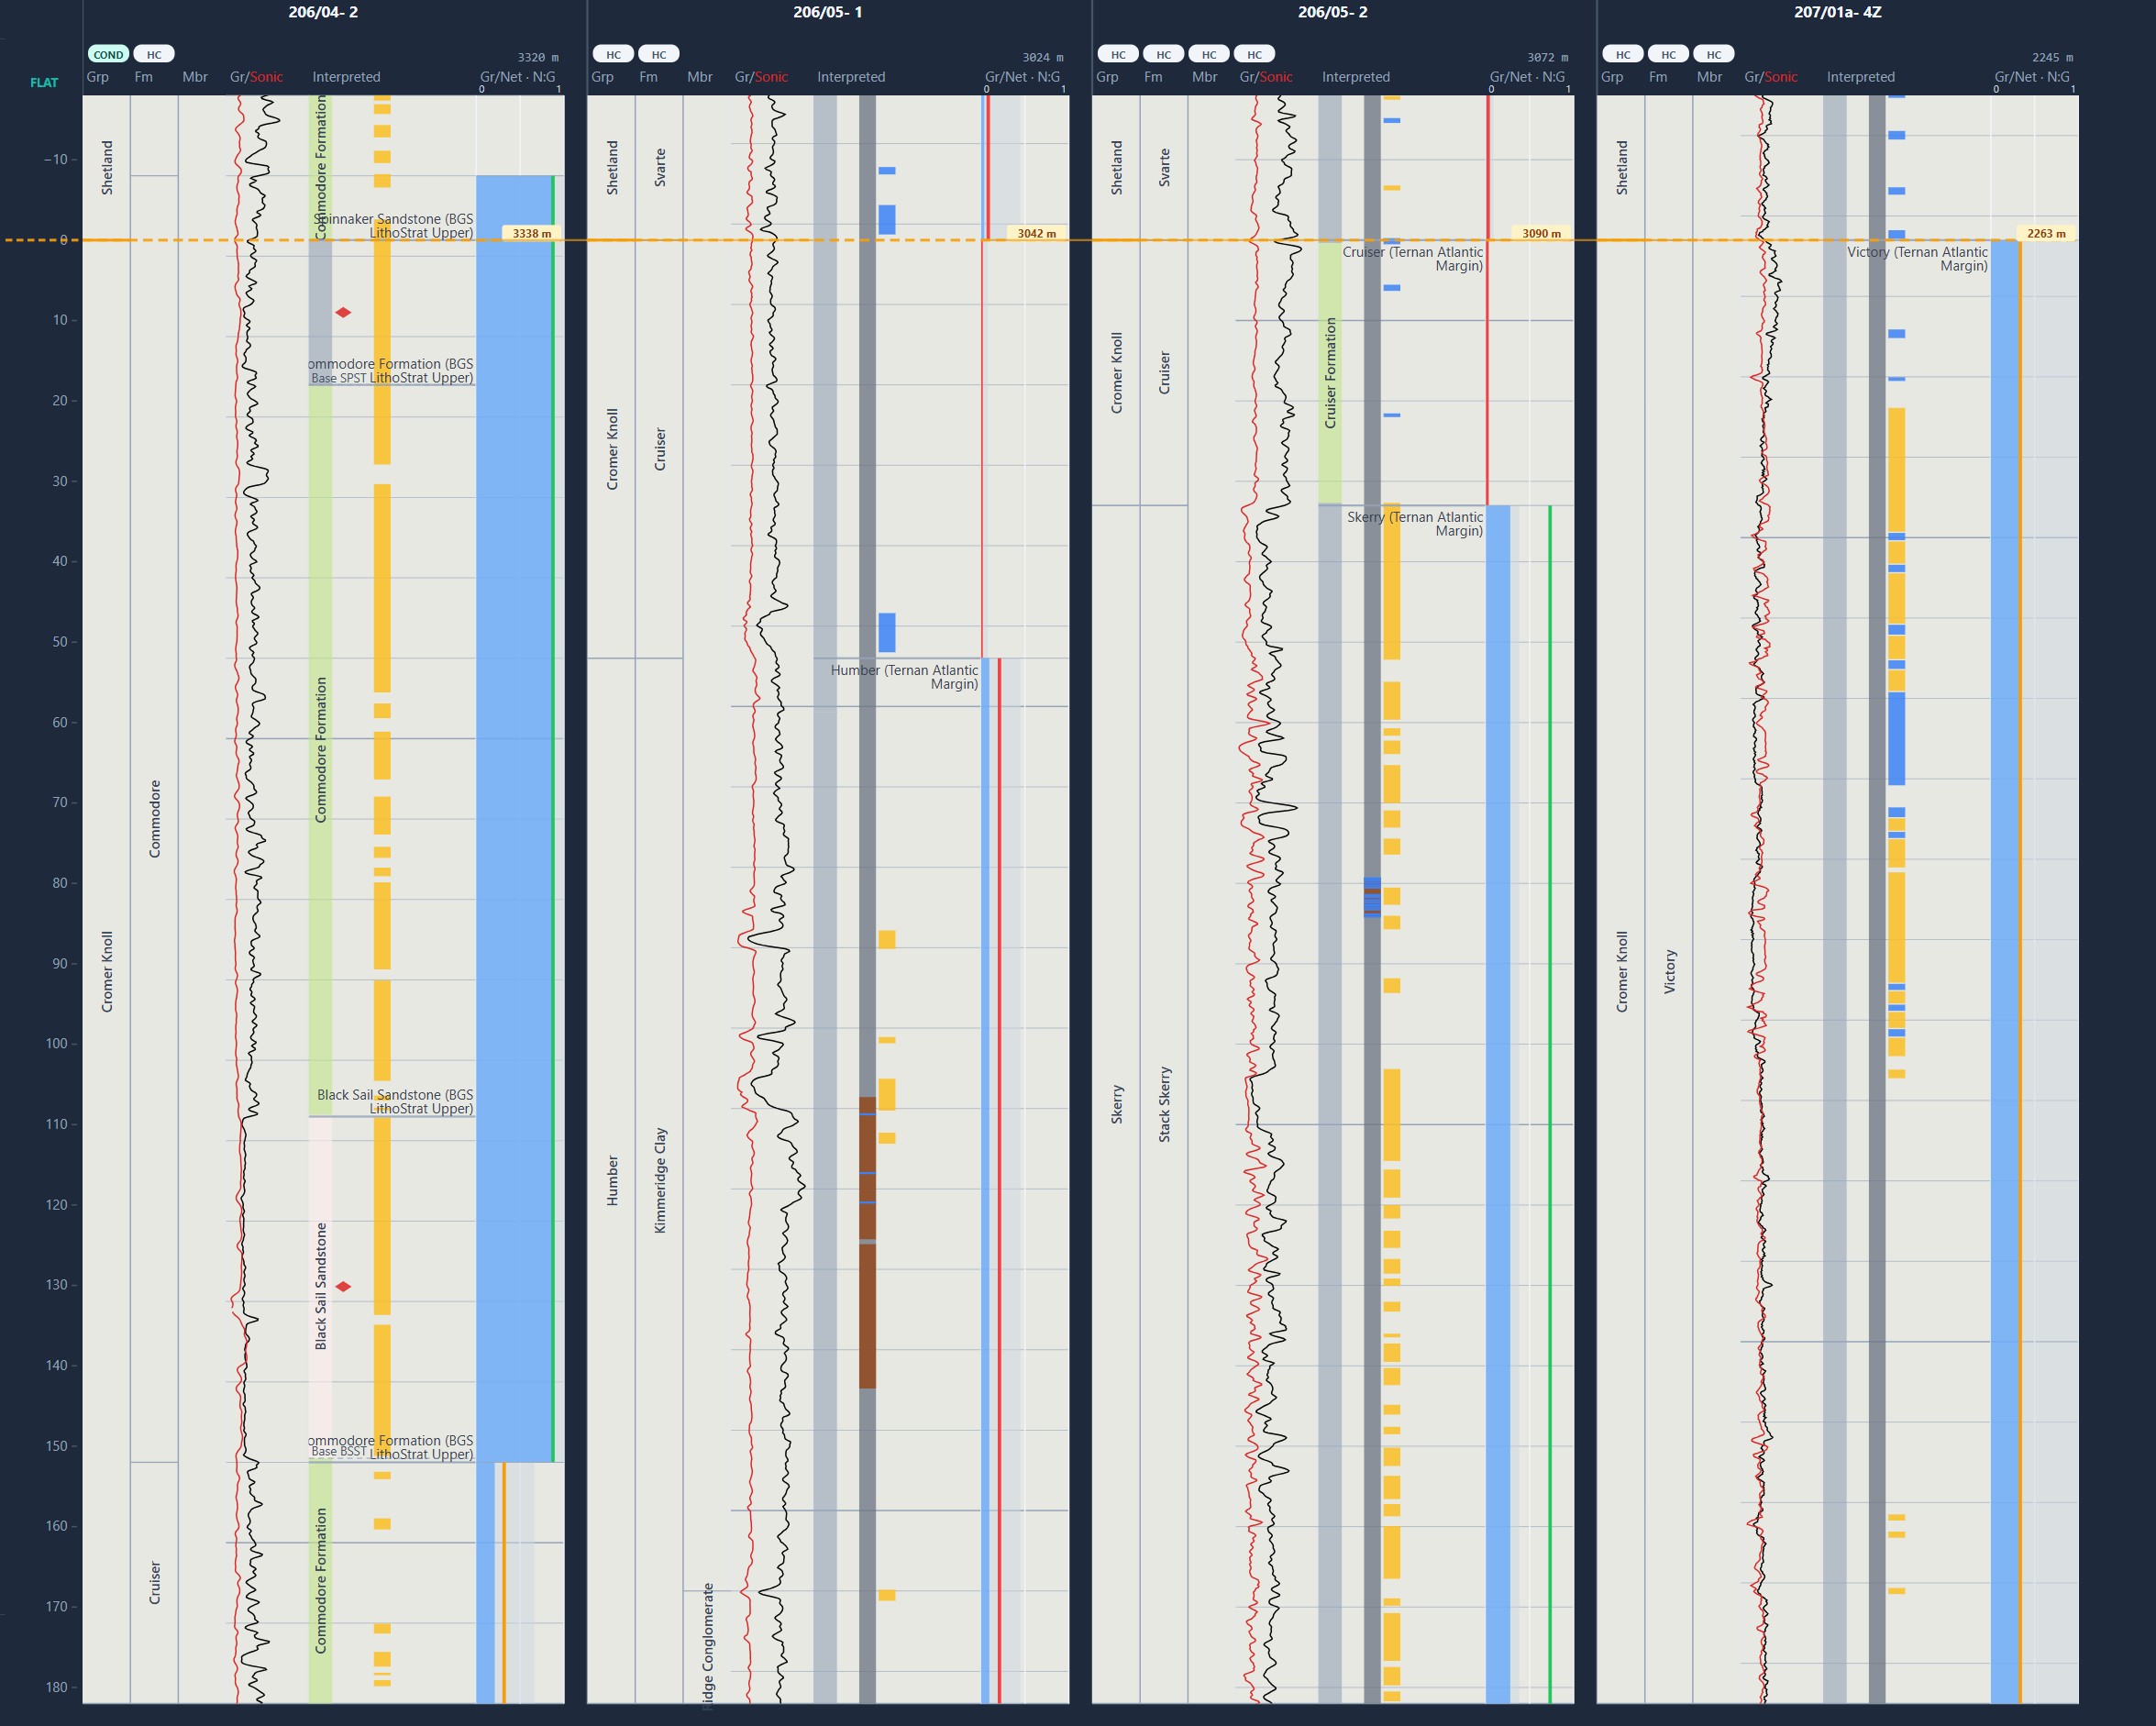
The database drives an interactive Cesium-based 3D viewer that renders wells, wellbores and deviated trajectories alongside formation tops, lithology intervals, core and cuttings samples, licence blocks, field outlines and depth-surface renderings — all navigable together in true geographic space, with attribute-driven symbology and voxel volumes that can be sliced by property (facies, thickness, stratigraphy) on the fly. Alongside the 3D scene, a dedicated log viewer renders full multi-track wireline curves per well, while a correlation view lets multiple wells be compared side by side to trace formations and flag stratigraphic relationships across a field or basin.
An integrated OpenSearch layer provides full-text search across the underlying document archive — well reports, completion summaries and other scanned deliverables — filterable by field, well or formation and surfaced directly alongside the well being viewed. Search results link straight back into the log and map views, with matching passages highlighted in an inline document viewer, so a geoscientist can move from a formation on the log straight to the report paragraph that describes it.
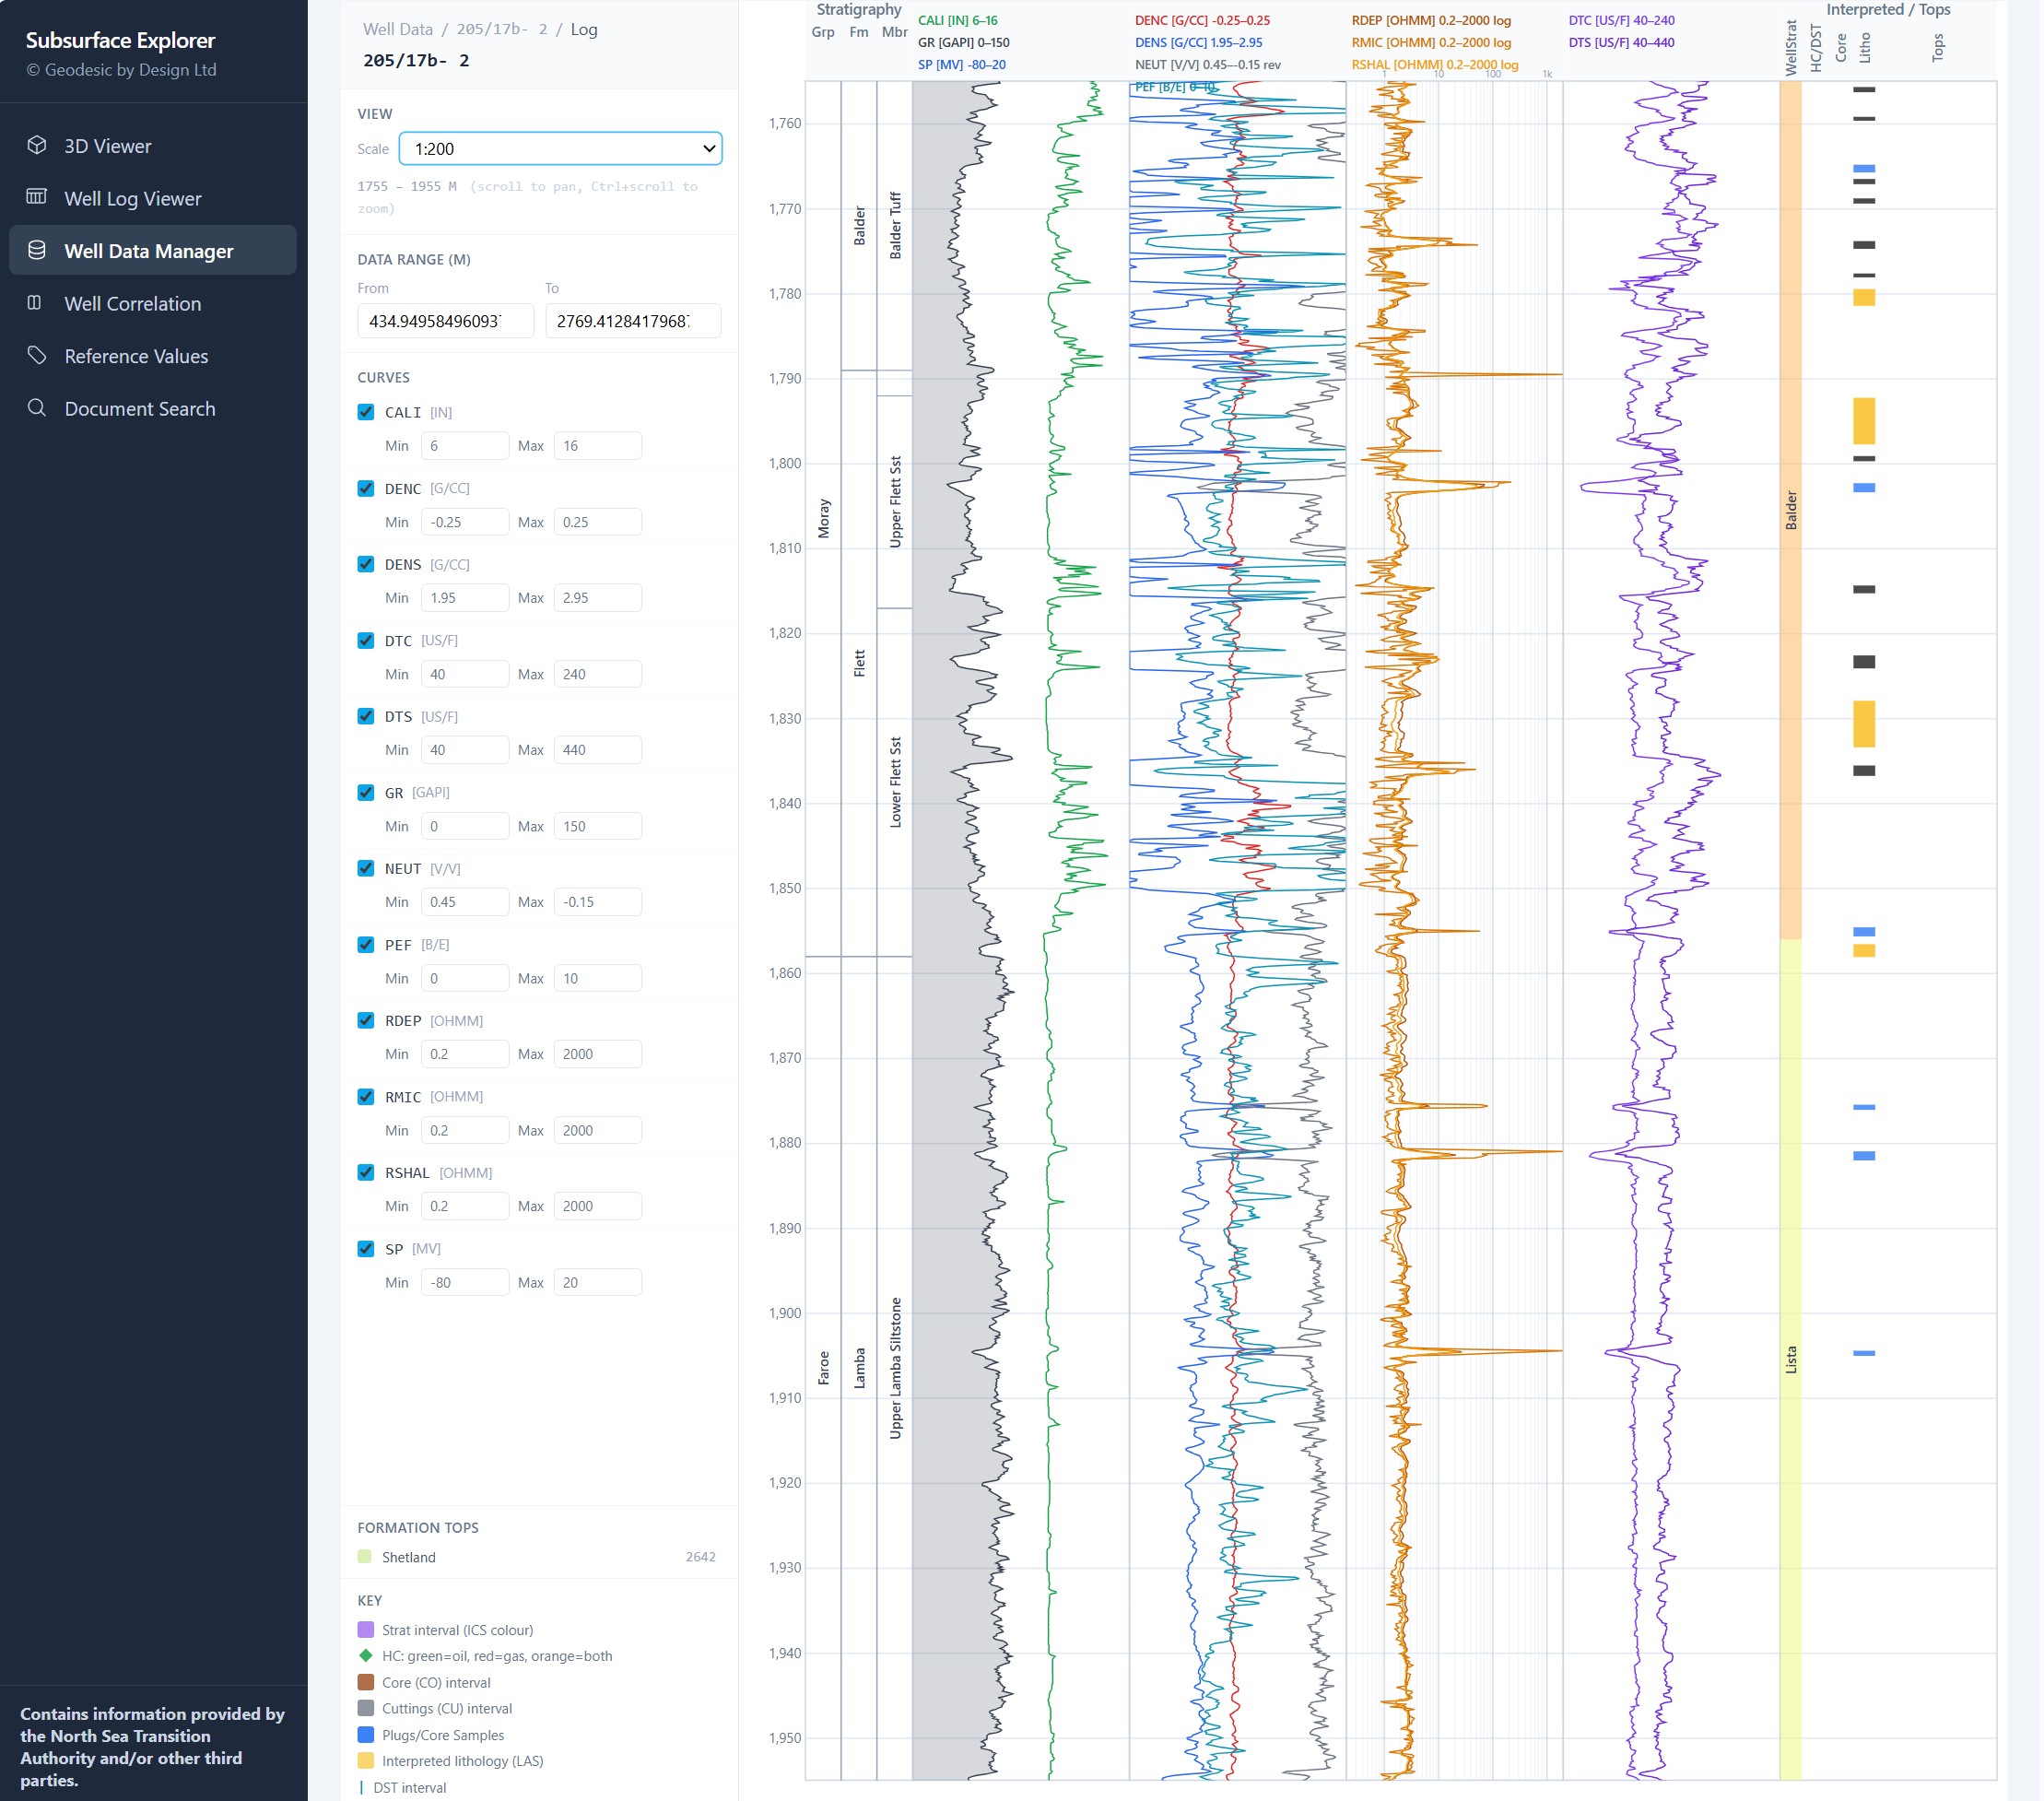
The geodatabase ties wireline curves, core samples and stratigraphy to a common depth and 3D framework, and so Subsurface Explorer provides the foundation for genuine subsurface analytics rather than just visualisation. Current work to calibrate wireline-derived properties against physical core measurements and density-derived porosity already shows a strong, unbiased correlation with core porosity across 17,000 matched samples — enabling log-based QC of core data, and predicting core properties such as permeability and saturation, with quantified confidence, in the many wells that were never cored at all.
The same approach scales well beyond porosity: automated QC flagging could catch depth-misalignment and bad values across the full core archive at a speed no manual review could match, while learned log-to-core relationships offer a path to filling gaps in reservoir property coverage across thousands of uncored wells. Combined with the stratigraphic harmonisation already built into the database — reconciling thousands of locally-named formations against national and international reference standards — the platform is positioned to move from consistent data storage to genuinely predictive subsurface analytics.
3D Subsurface Viewer
Well trajectories, formation tops, lithology, hydrocarbon shows, and DST intervals rendered in true 3D from deviation-survey-accurate positions, alongside licence blocks, field outlines, and voxel-based geological volumes.
Interpreted Well Data
Formation tops, interpreted stratigraphy, hydrocarbon occurrences, and core/cuttings samples with lab-measured porosity and permeability, cross-referenced against the BGS Lexicon and ICS timescale.
Well Correlation & Log Viewer
Multi-track wireline log plots and a side-by-side well correlation view for comparing stratigraphy and log character across a field or project area.