
UK Power Networks Common Operating Picture (COP)
Interactive mapping of UK power infrastructure and distribution networks
Some benefits of the COP
A key benefit of the geospatial approach is its ability to aggregate data from multiple sources into a coherent operating picture, enabling evaluation and analysis based on that integrated view.
Data quality can benefit from this approach. Issues in respect to the spatial integrity, consistency and coherence of datasets become visible when data are compared against one another. For example, the Digest of UK Energy Statistics (DUKES), are accredited official statistics and an essential source of energy information for UK energy policy, but a spatial comparison reveals that a significant proportion of the data points are mis-located, with a potential knock-on effects for policy decision making.
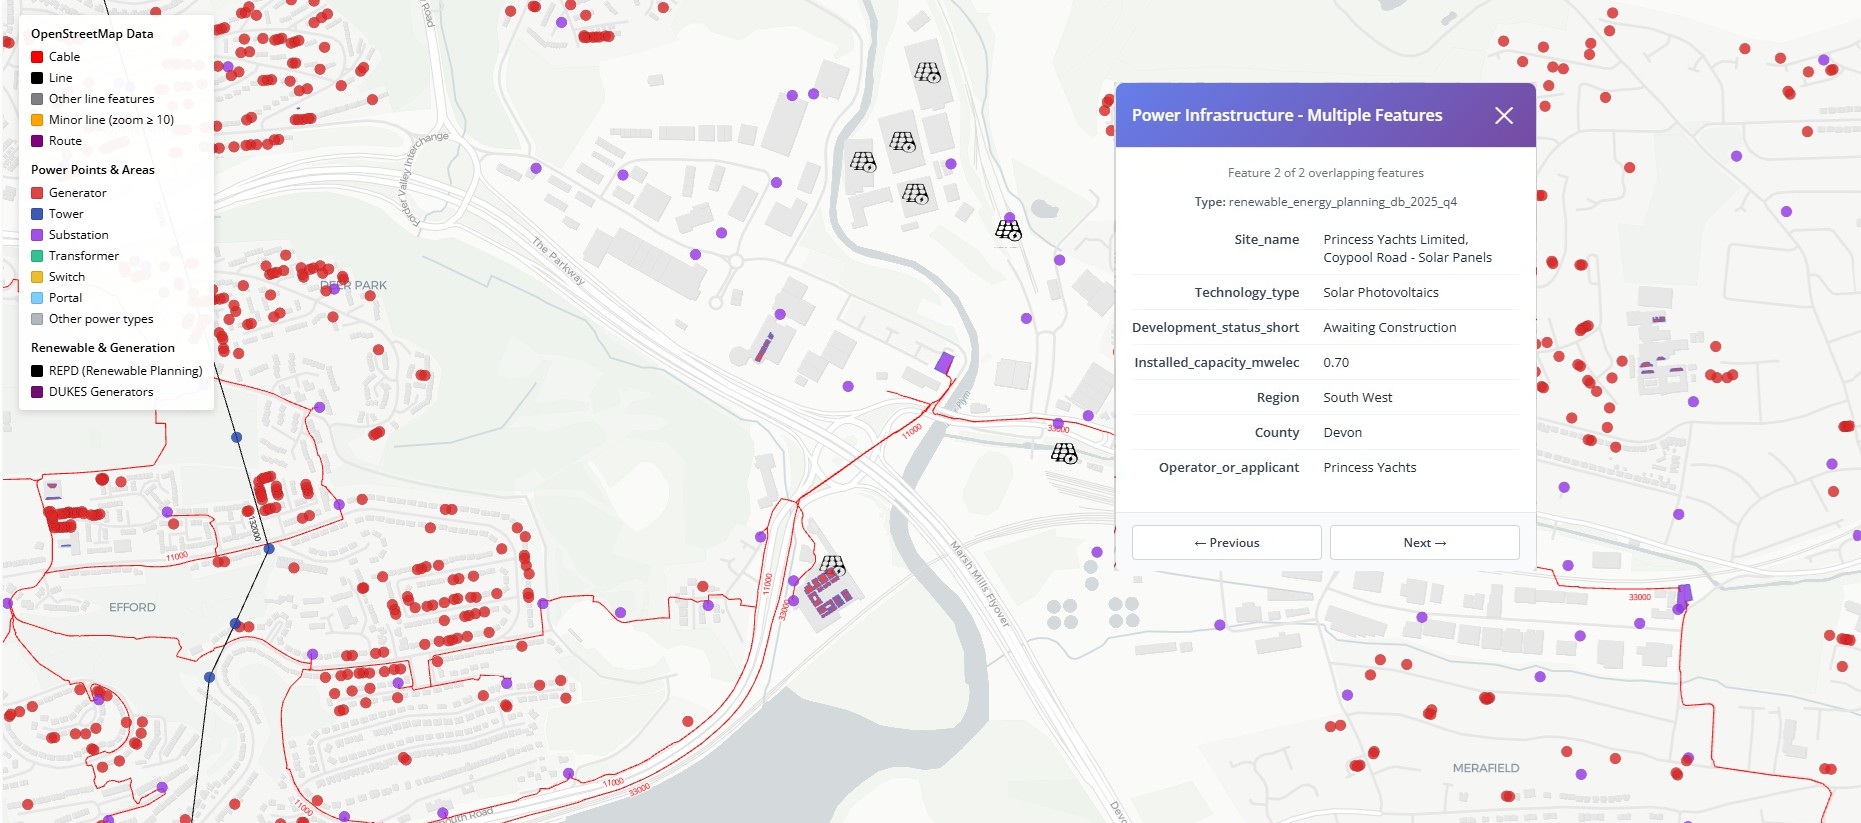
GOV.UK also publish accredited official statistics for Solar photovoltaic panels deployment and the common operating picture of UK power infrastructure presented here also provides a potential method of external verification for these statistic. Open Street Map represents a 'crowd-sourced' approach to data verification, where the location of solar voltaic panels is provided by the public. Remote sensing methods, particularly those enhanced by AI also provide the potential for additional verification by providing methods whereby the automated extraction of photovoltaic panel from satellite imagery can also be undertaken. (Example reference 1, Example Reference 2)
The UK power common operating picture map will continue to evolve as more dataset are identified and verified, and as more spatial analytic methods are tested and deployed. Watch this space.
Highlights
An interactive map of the UK's entire power network — electricity lines, substations, towers, power stations and more, drawn from OpenStreetMap.
Includes the Renewable Energy Planning Database (14,000 renewable sites) and the DUKES register of active and historic power generators.
Clicking a feature queries a live database and returns its properties — voltage, status, fuel type, capacity, operator and more — in a popup panel.
Six background maps are available — street, topographic and satellite — so power data can be viewed in the most relevant geographic context.
Built for speed and resilience: pre-computed tiles handle national views, results are cached, and the system falls back gracefully if any query returns empty.
The application is built on a FastAPI Python backend serving live map tiles and data queries from a PostGIS spatial database, with an asyncpg connection pool handling concurrent requests efficiently. The frontend combines React with MapLibre GL for the interactive basemap and deck.gl for high-performance vector tile rendering.

Data sources
OpenStreetMap contributors (ODbL), BEIS Renewable Energy Planning Database Q4 2025, DUKES power generators registry.
Map layers
OSM power lines, substations, and generation polygons served as Mapbox Vector Tiles with configurable styling by voltage class and infrastructure type.
Filtering & search
Real-time filtering by voltage, fuel type, development status, and region. Click any feature to inspect detailed attributes from the underlying dataset.
Government data
REPD and DUKES overlays show the full pipeline of renewable projects — from planning application through to operational generation and eventual closure.